
Harnessing Komiser and Grafana for Custom Cloud Dashboards
Get the best of Komiser without having to diversify your cloud dashboards! Combine Komiser and Grafana to build interactive dashboards that make sense to you.

Access to data is crucial for DevOps engineers, developers, and SREs as it empowers informed decision-making. In the realm of cloud administration, managing a vast array data sources such as cloud provider service dashboards, third-party tools, databases, and data lakes just comes with the job, particularly with the rise of multi-cloud architectures. However, visualizing this data presents a challenge, as it becomes impractical to maintain separate dashboards for each data source.
Fortunately, Komiser provides a solution by efficiently fetching all resources within your organization, ensuring comprehensive coverage. Komiser not only actively fetches your resources but also presents them in a user-friendly interface. Moreover, if you prefer visualizing the data in a dashboard that’s more familiar to you, we have you covered.
With this in mind, our goal is to demonstrate the simplicity of configuring Grafana to visualize data obtained by Komiser. By doing so, we aim to enhance the accessibility and efficiency of the process, allowing you to make the most of your data and offer you the highest amount of flexibility when monitoring your cloud infrastructure.
Why would you do this?
A couple of reasons, you might identify with one or both of the following personas:
- The “one stop shop dashboard” cloud administrator: You may already be heavily using Grafana for creating dashboards and are interested in dashboard consolidation by aggregating all of your data sources in one place.
- The “let’s cut the fat” cloud administrator: Perhaps you are only interested in a subset of data that Komiser fetches. You might want to just cut to the chase and show directly what’s relevant to you and discard the rest.
Regardless of your particular use case, you’ll see just how easy it easy to extract value from the data fetched by Komiser and how we can set up a clear, concise and interactive Grafana dashboard in no time.
Let’s launch some infrastructure
💡 You can find all the code used in this demo here.The resource requirements to set up our Komiser data-sourced Grafana dashboard are the following:
- An instance of Komiser (configured with a config.toml file and credentials file.)
- Grafana
- PostgreSQL database
The easiest way to set these three tools up is by using docker-compose, you can find the docker-compose.yml file used in this demo, here.
This is the sequence the docker-compose.yml file will follow:
- It’ll launch a containerized instance of Komiser using the latest stable version at the time of writing this tutorial, the container will have two volumes attached to it, loading the two files needed for Komiser to run, the config.toml file and the AWS credentials file (only needed if an AWS account is integrated, which is the case in this demo). As you can see, we are also adding a depends_on key to make sure that the Komiser instance is only started once the Postgres db instance is up and running. Additionally, since I’m configuring an AWS account we will load the local credentials file from .aws/credentials and map it to the docker container path usr/bin/credentials.
- Underneath, it will launch a containerized instance of Grafana and map it’s native container port 3000 to the browser port 3001 since Komiser is already using browser port 3000.
- And finally, we are provisioning a containerized PostgreSQL server which will serve as the data persistence mode for Komiser. We are keeping it simple and using komiser as the value for all three requisite environment variables (POSTGRES_DB, POSTGRES_USER, POSTGRES_PASSWORD)
.png)
Below you can see an example of the three cloud providers we will add to this demo. We are working with:
- AWS (Production)
- MongoDB Atlas (Staging)
- Civo (Development)
💡 If you need help configuring your config.toml file, give this a read..png)
To run the docker-compose file run docker-compose up, subsequently, you should see a stream of Komiser, Grafana and Postgres generated logs which will be your first source of information if any errors or unexpected behavior is detected.

Run docker ps or head over to your docker hub console to check if the containers are up and running.

If they are, access the Komiser dashboard at localhost:3000 and make sure the expected cloud data has been fetched.

Look’s good, now let’s build our alternative Grafana dashboard.
Build the Grafana dashboard
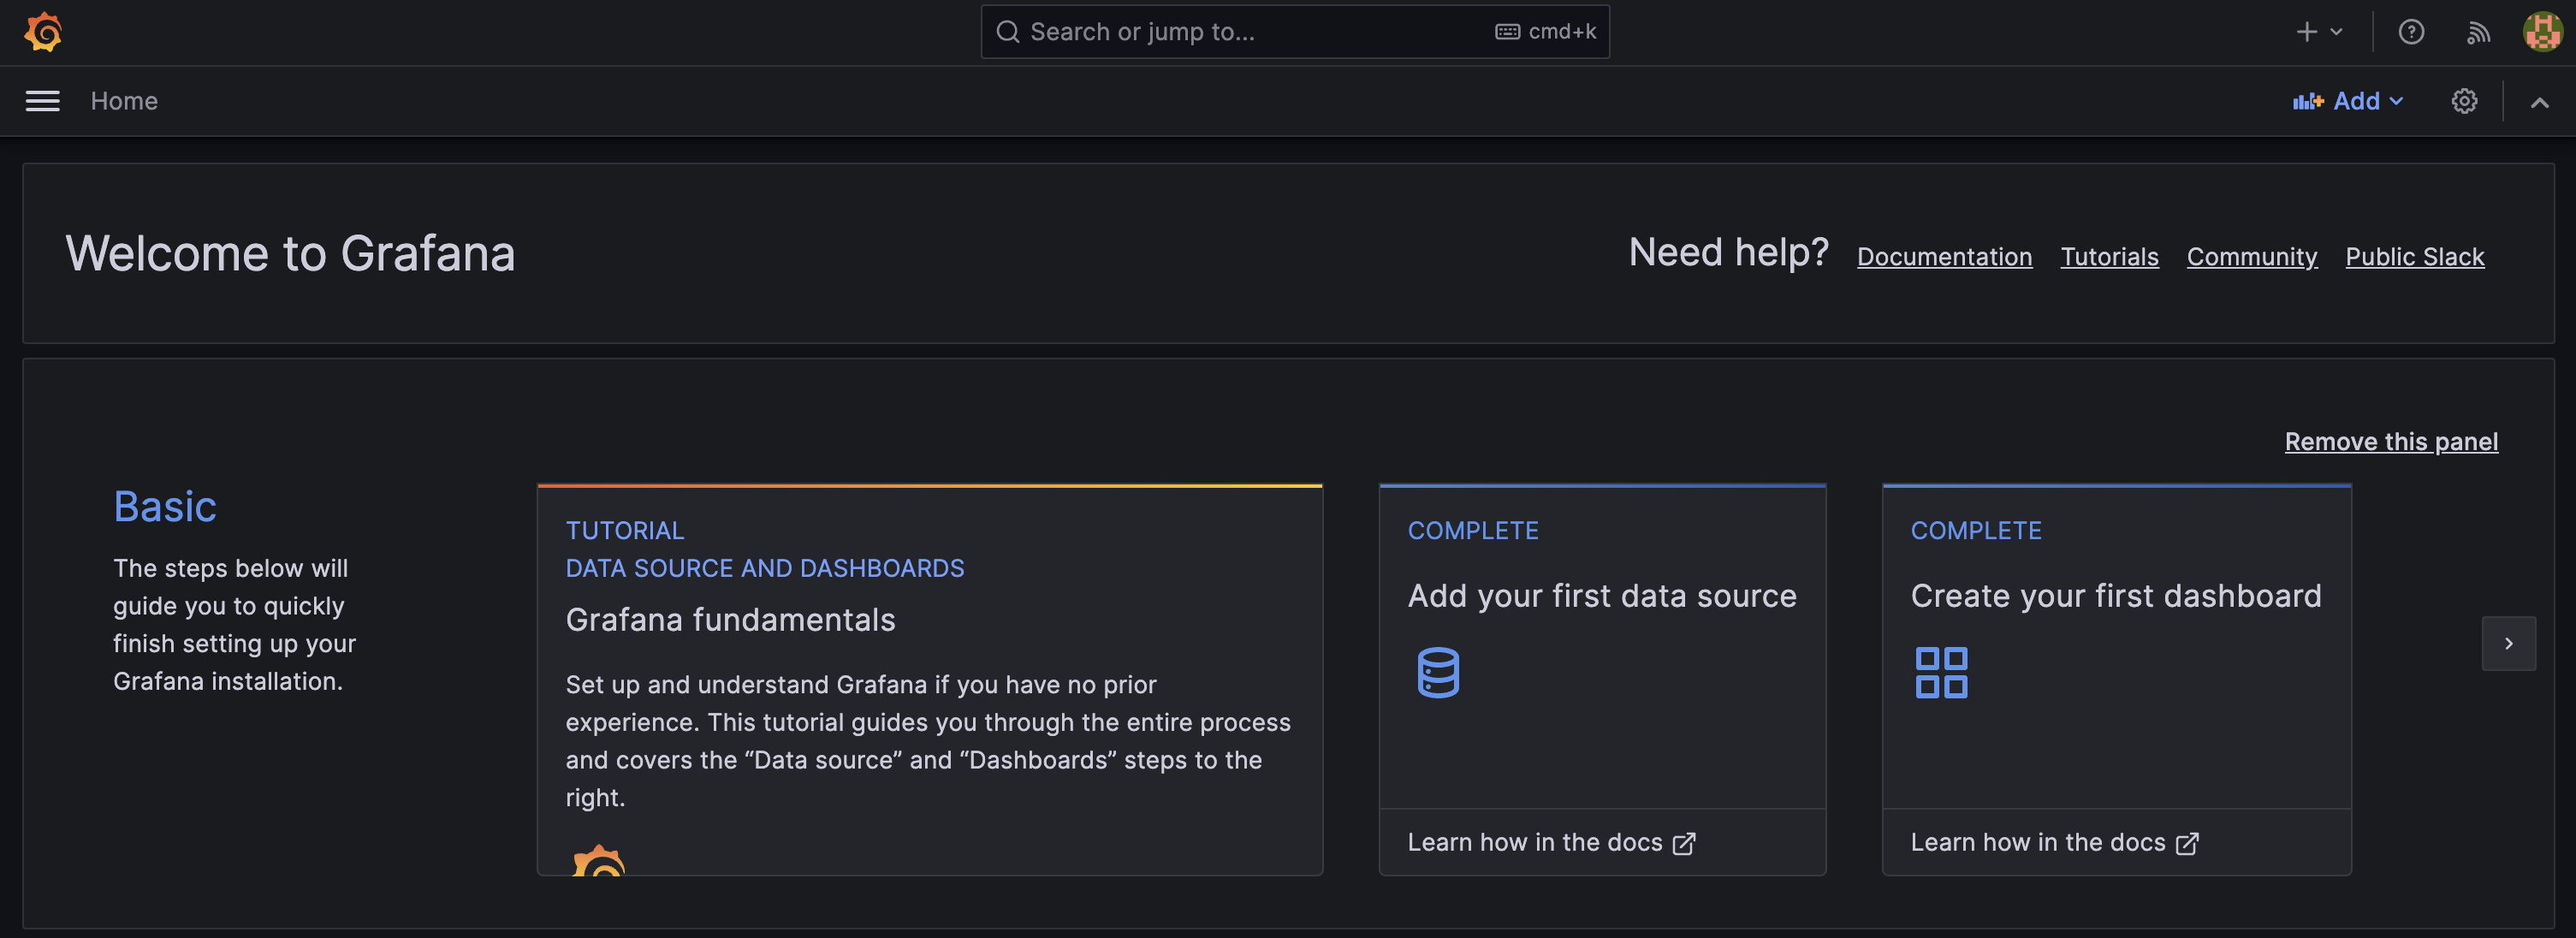
Access the local deployment of Grafana by accessing localhost:3001 and signing in with the default username and password of admin/admin. You will then be prompted to change the password. Once you’ve done so, you can access the Grafana home screen where you will begin configuring the Postgres db as the data source for the dashboard. Click on Add your first data source to get started:
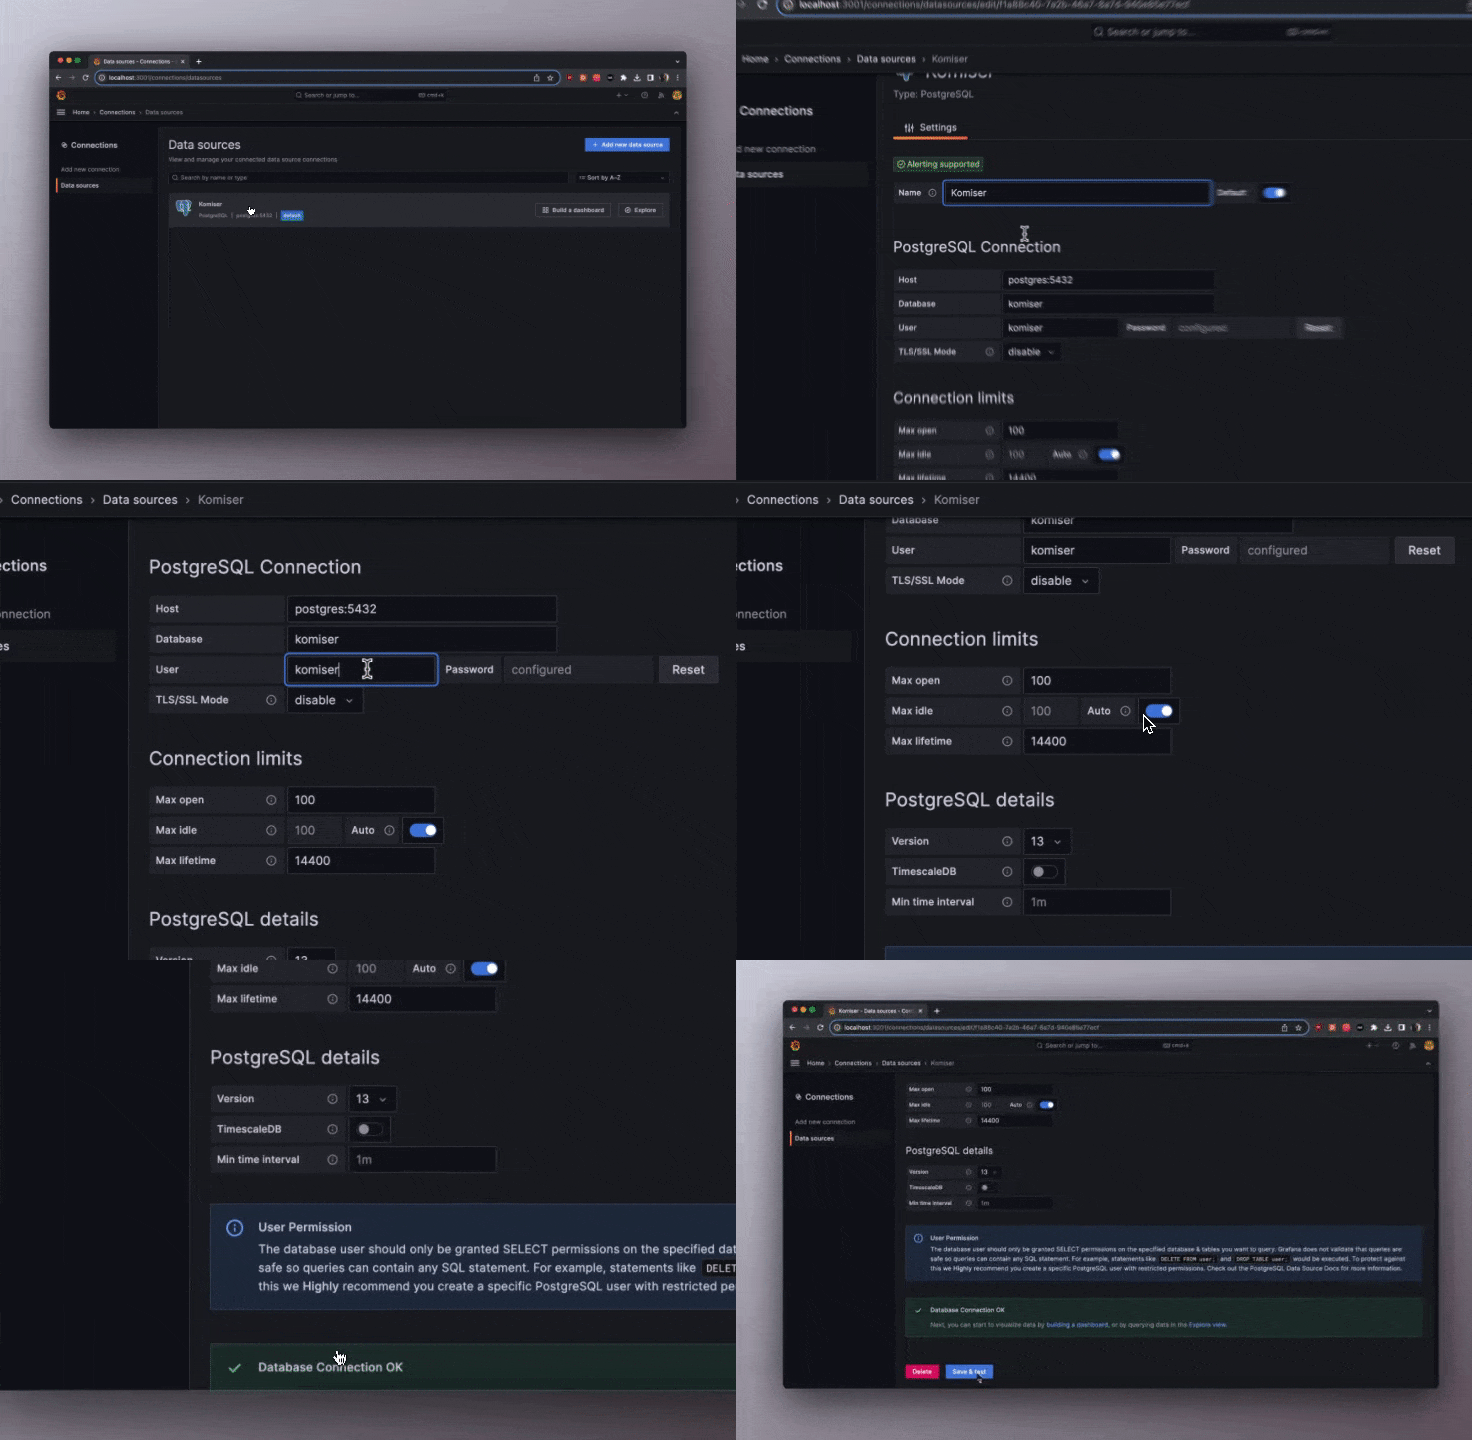
Now add the database name, user and password as well as disable the TLS/SSL mode as seen below. Remember to click the save and test button to make sure the data source is configured correctly and Grafana has access to the data loaded into the database.
You can either start a new dashboard from scratch or import the dashboard created in this demo. To import you can click on dashboards/new/import and upload this demo dashboard’s json file.
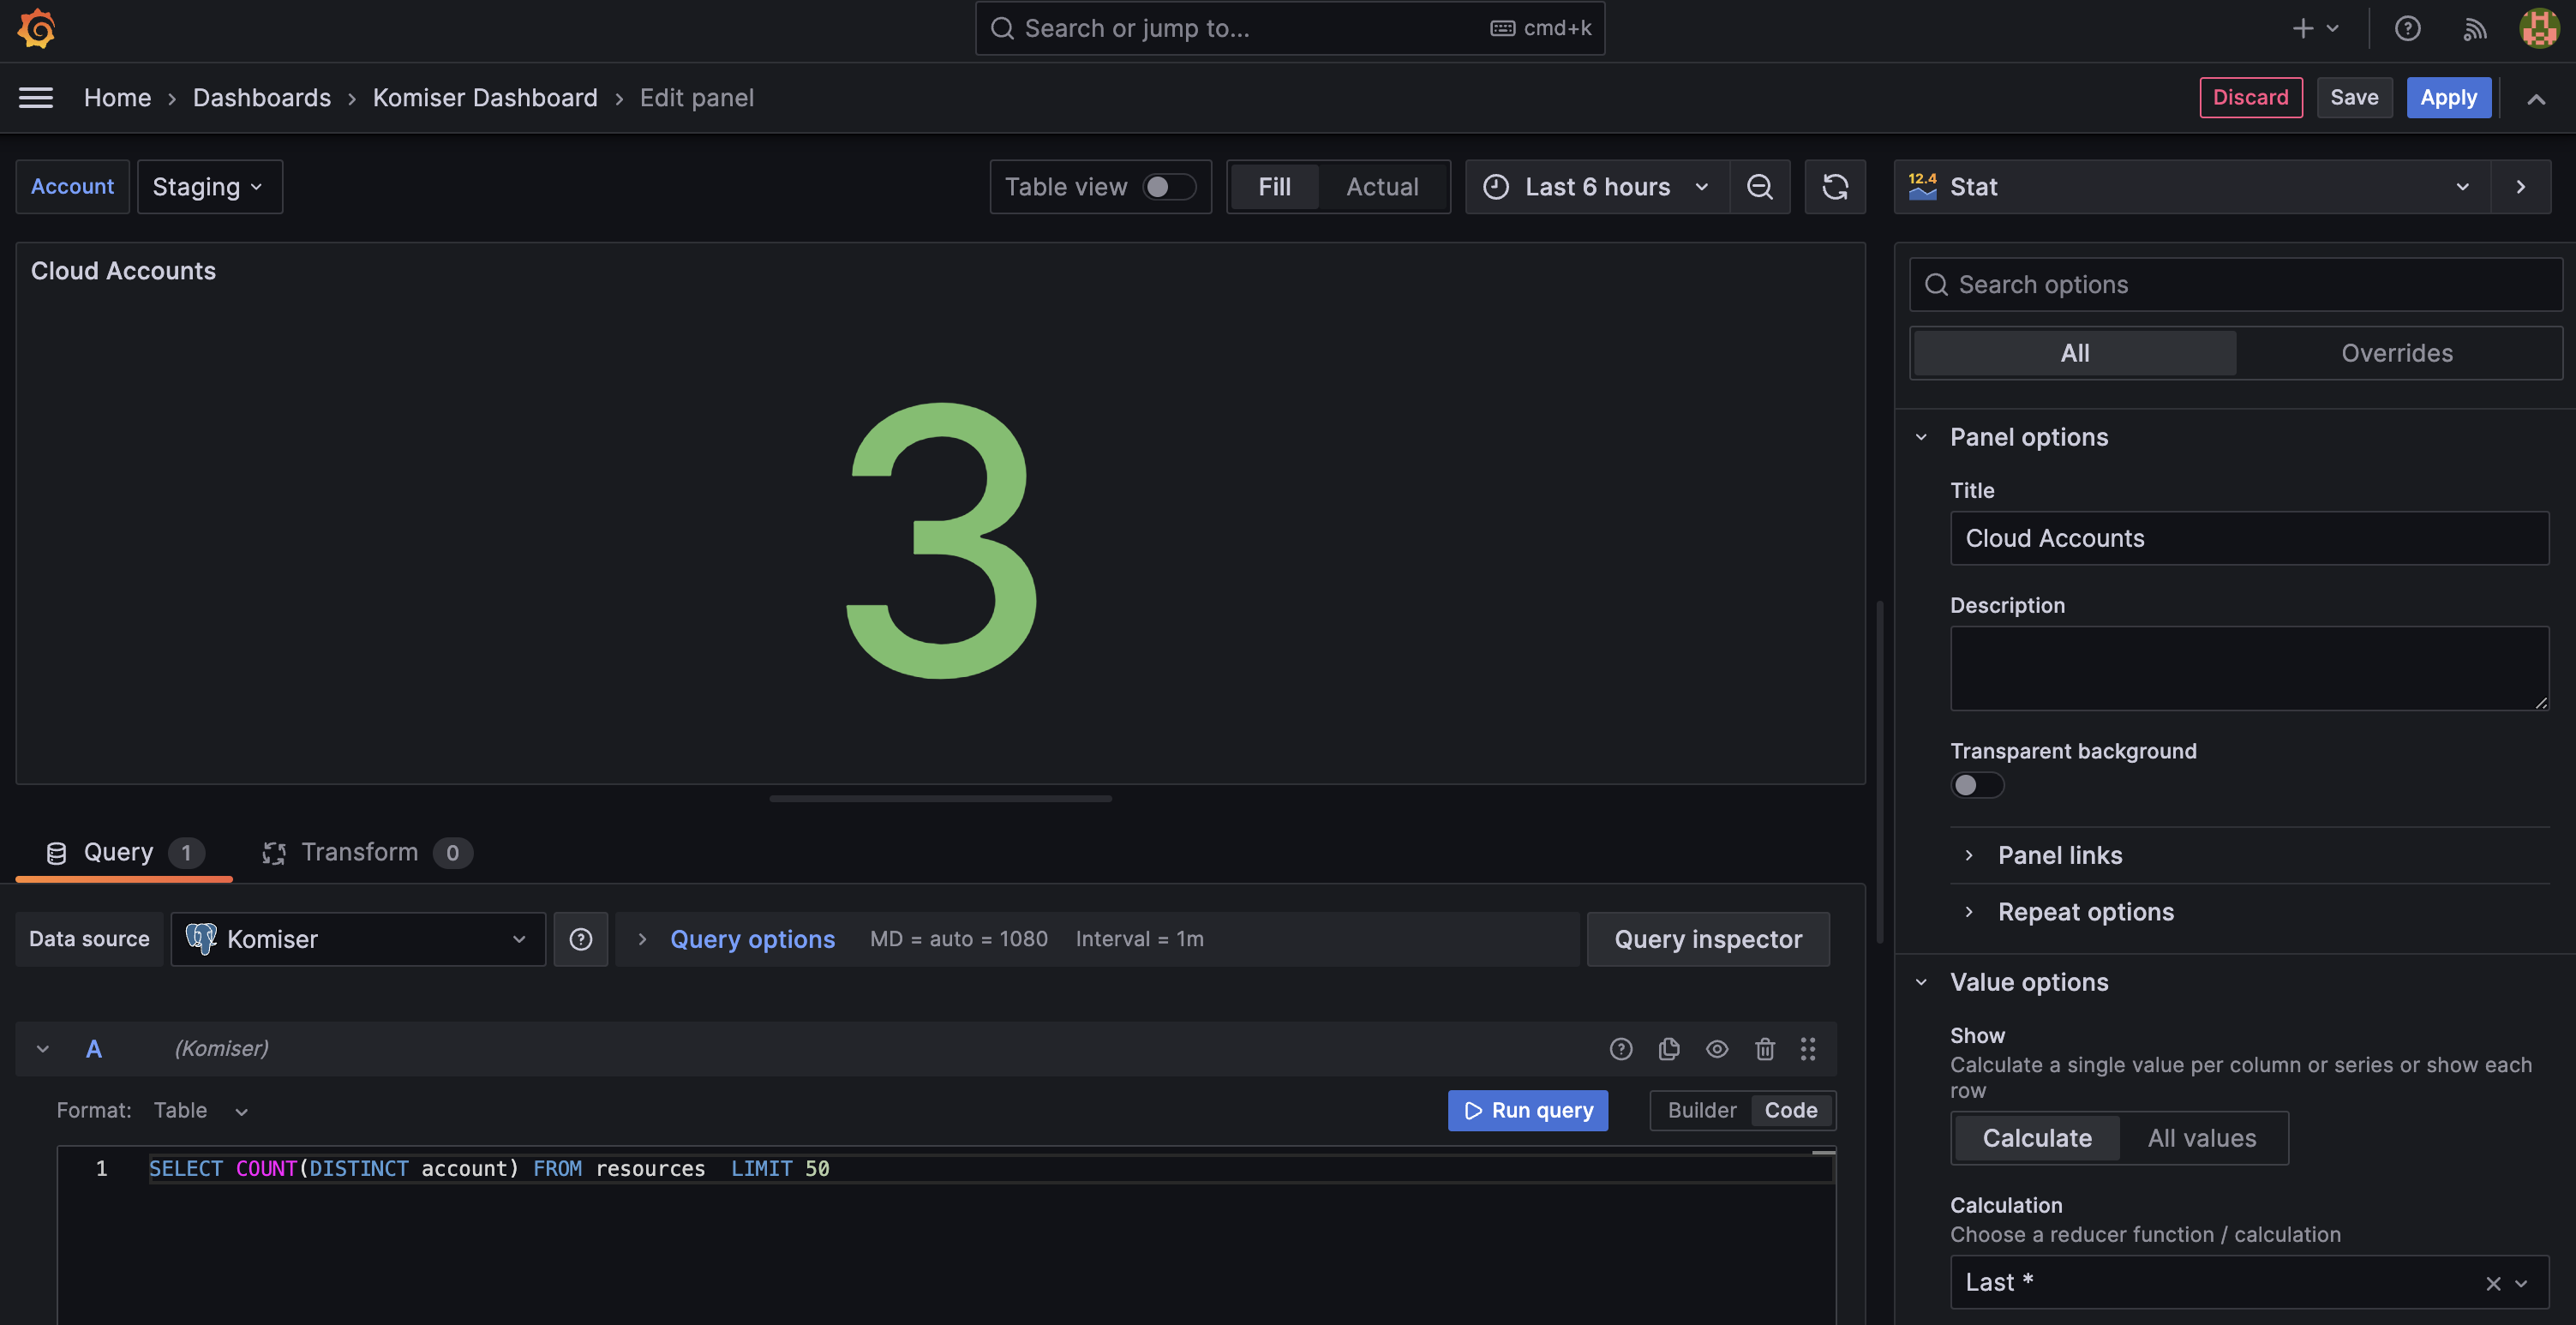
If you’d prefer to create the dashboard from scratch you can build each widget below by choosing the Postgres data source and building the SQL queries and visualization widget to represent the information. Below I’m counting the distinct cloud accounts that are found in the resources table. The correct output is three since we configured AWS, Civo, and MongoDB Atlas as the only cloud accounts.
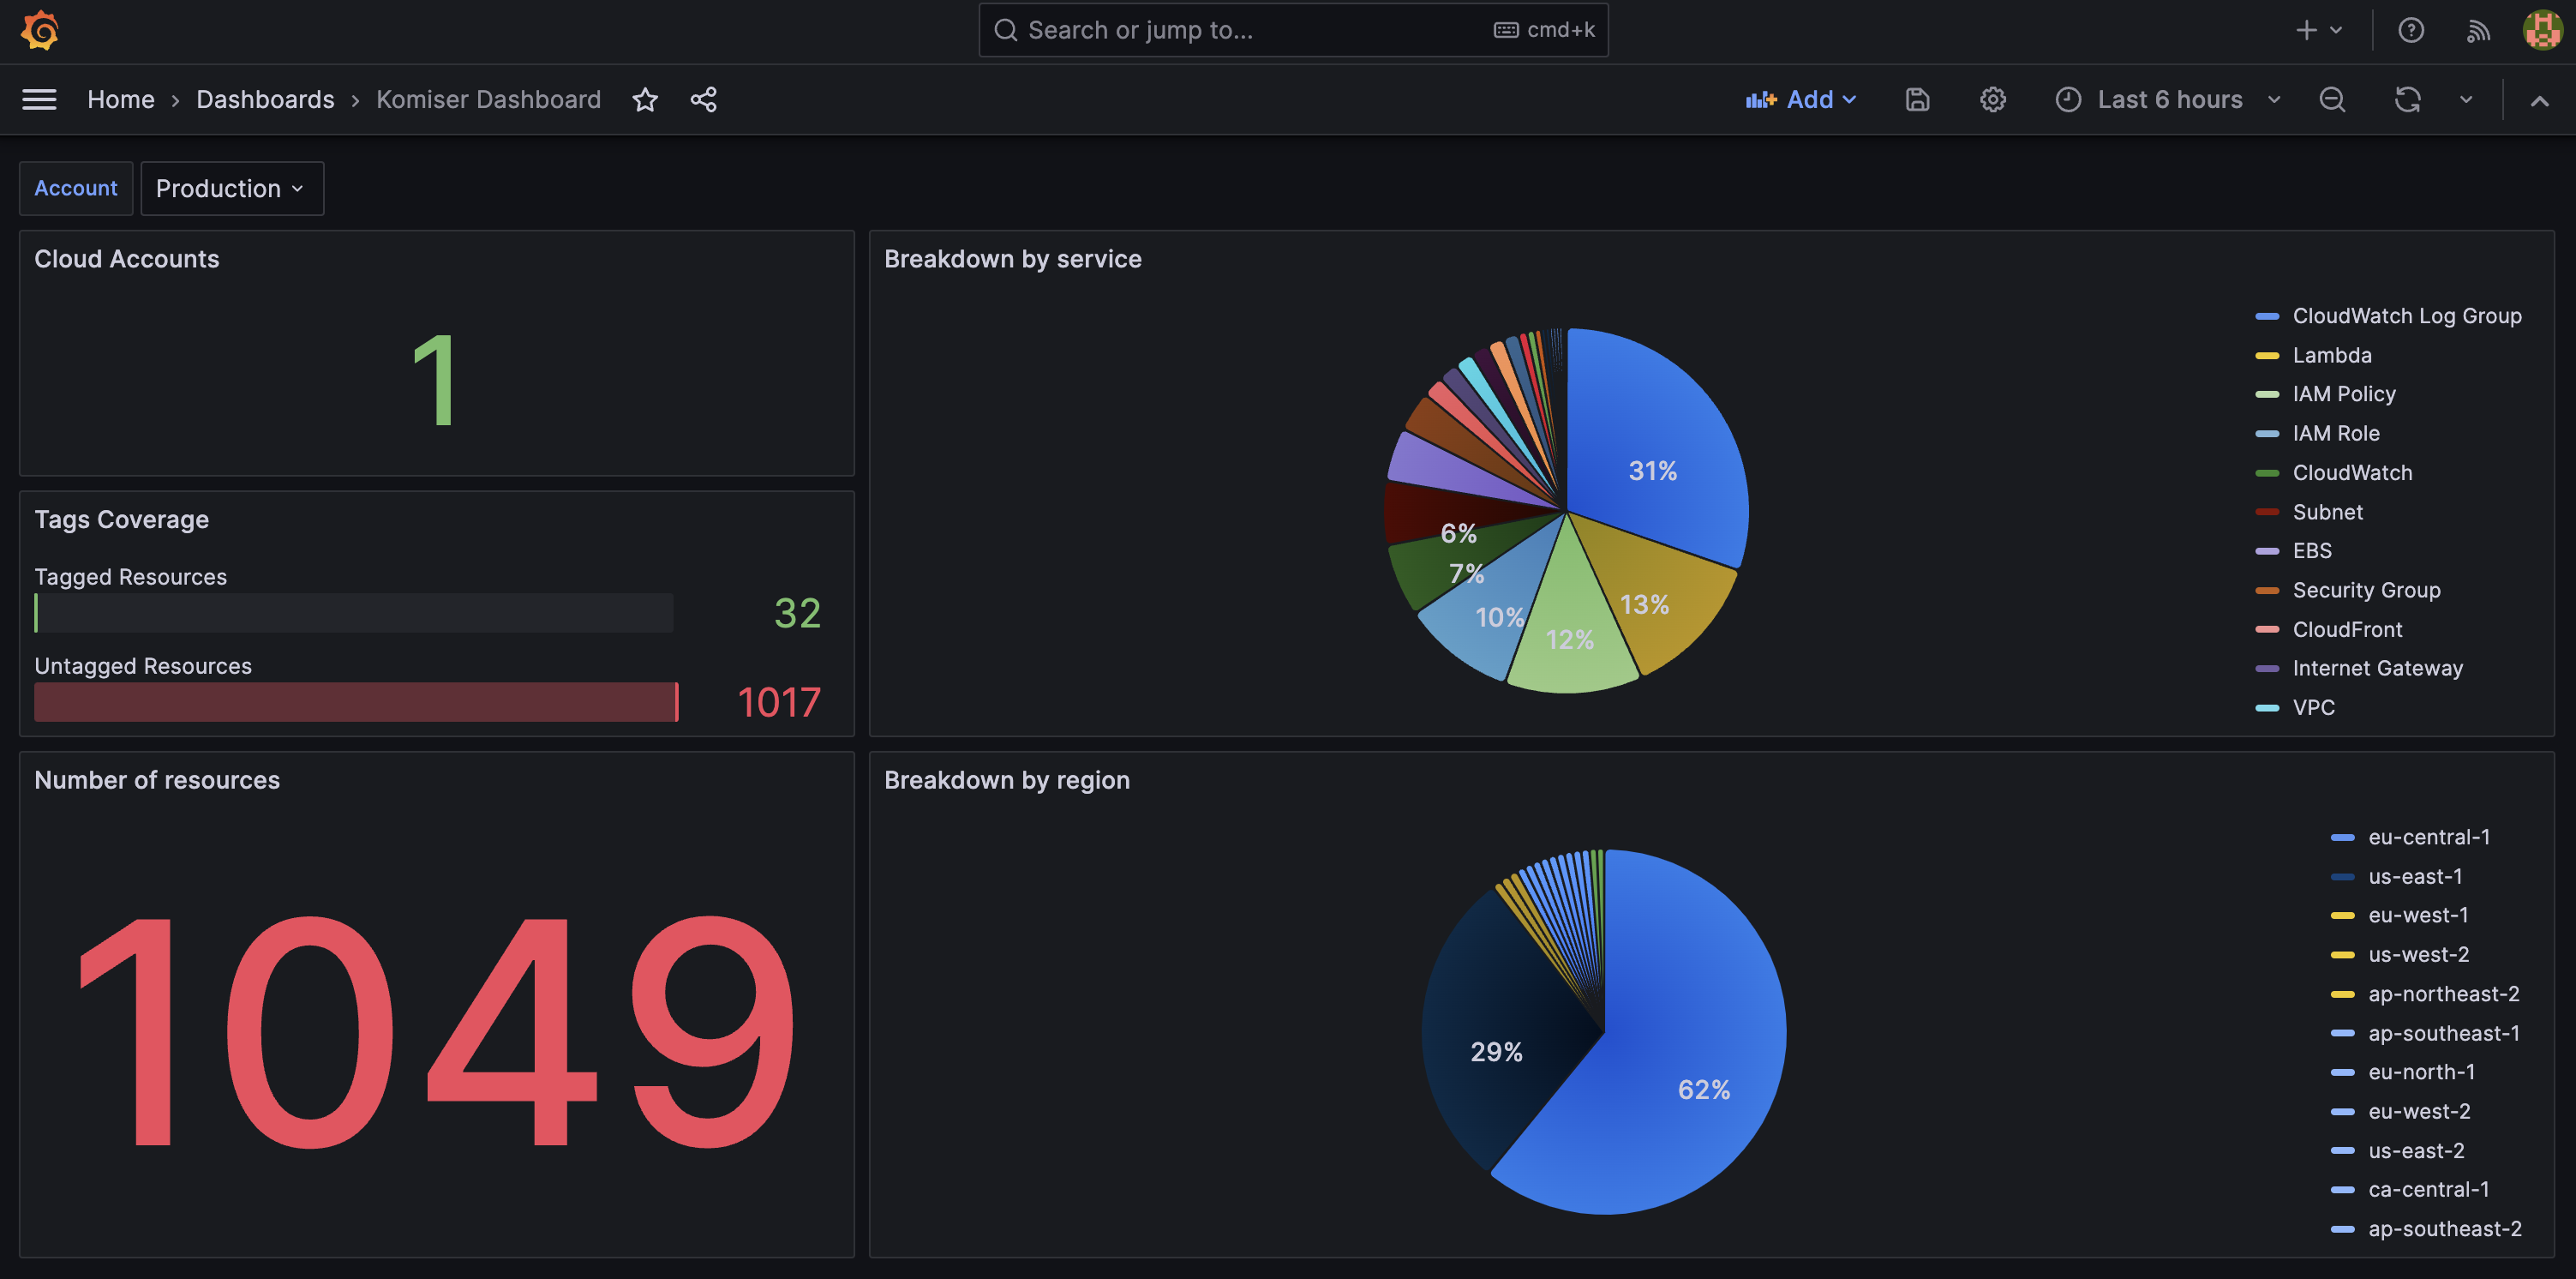
At this point the possibilities and available data visualizations are vast. Below I’ve created a dashboard that contains the following widgets:
- Number of cloud accounts
- Tags coverage
- Number of resources
- Breakdown by service
- Breakdown by region
You might have noticed that I have not aggregated all of the resources into a single view. That’s because I have leveraged the Grafana dashboard variable feature. By exposing a variable, in this case Account, it can then be used in the individual widget SQL queries. This allows for quick access to three account-level dashboards (Development, Staging and Production) through the exposed Account toggle in the top left of the dashboard.
Below you can see the SQL query used to expose the Account variable in the dashboard variable section of the Grafana console.

Now, you can edit the individual widget SQL queries to include the Account variable, allowing for an easy and interactive toggling experience between account dashboards.
.png)
As you can see here

At the end of the day, there is no “one size fits all” when it comes to cloud environment resource monitoring. In a multi-cloud environment, the potential ways to monitor and manage your sprawling infrastructure are massive. It’s important that you have a clear conception of the crucial data that matters to you and your environment. It’s paramount that the complexities and nuances of multi-cloud infrastructure management don’t overwhelm you and that the tools you use to enable you to be the most efficient custodian to your organisation’s resources are easy and accessible. Hopefully, Komiser proves to be one of those cloud management tools that takes operational overhead off your plate, regardless if it’s by its easy integration with Grafana or by using the native Komiser dashboard.


